
The 2021 school year – especially the beginning of it – will be different from anything we’ve experienced before. There will be plenty to document and cover, but in addition to taking great photos and crowdsourcing even more photos, yearbook staffs may have to get creative with their coverage. Fortunately, we have infographics.
Infographics – a visually striking way to share information – are popular on social media. You’ve likely seen them used to share all kinds of information. But they also have a place in your yearbook! They’re a great way to include data or information while providing a break from longer stories.

What to put in an infographic
Think about what your audience wants to know and what they’ll want to remember many years from now. If your school offers both remote and on-campus learning, you may want to use an infographic to show how the student population is divided. If the school year was delayed, you could find an interesting way to show how the dates compared to more normal school years.
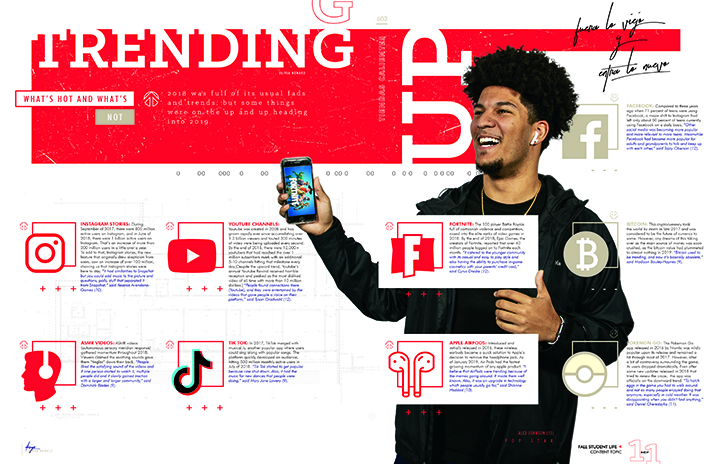
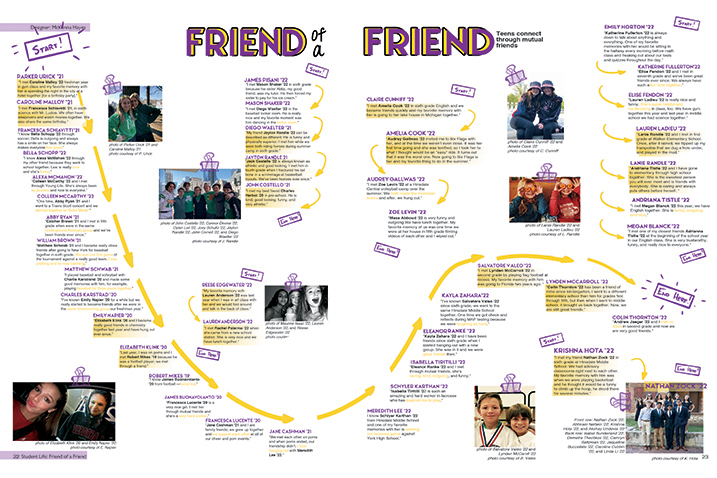
Is there an interesting way to show the new regulations, like social distancing, that are in place to keep people safe? You could cover what’s trending, like this spread from the Munhinotu yearbook from Gresham High School in Gresham, Oregon. Or check out this spread tracing friend connections from the El Diablo yearbook from Hinsdale Central High School in Hinsdale, Illinois. The Hauberk yearbook from Shawnee Mission East High School used student quotes and simple graphics to effectively illustrate the effect COVID-19 had on the school’s population.
You can also use infographics to highlight student achievements. Perhaps a student at your school started running, walking or cycling to pass the time. You could create an infographic illustrating the distance they’ve traveled! Or you could source information from your student body using polls. You could also use a service like Google Forms, SurveyMonkey or even a social media poll to collect data.
News outlets – especially those with the resources to devote time to making great infographics – can be a great place to find inspiration. Pick up a paper or pay attention when the news comes on your television. Magazines are always a great place to look for design inspiration, but pay extra attention to the infographics they use next time you’re browsing.
When you create your infographics, don’t forget to include a footer with sources if appropriate.
How to make infographics
There are tons of sources online that can help you create an amazing infographic. If you have a Creative Cloud account, you can use Adobe Spark to create a stunning design. Even if you don’t have access to use Spark, it’s worth browsing their template page for ideas.
The free and extremely popular design site Canva offers more than 100 infographic templates, along with instructions on how to make a great infographic.
You can find plenty more instructions and ideas for creating great infographics in places like YouTube.
Get the most out of your work
Once your infographic is made, consider if it’s worth sharing on social media ahead of time. This could be a great way to drum up additional interest in your 2021 book and let the student body know there will still be plenty of good content in the book.
For more ideas on covering a school year like no other, visit our Back to School coverage page.
